
Data analysis and visualization
Data analysis and visualization
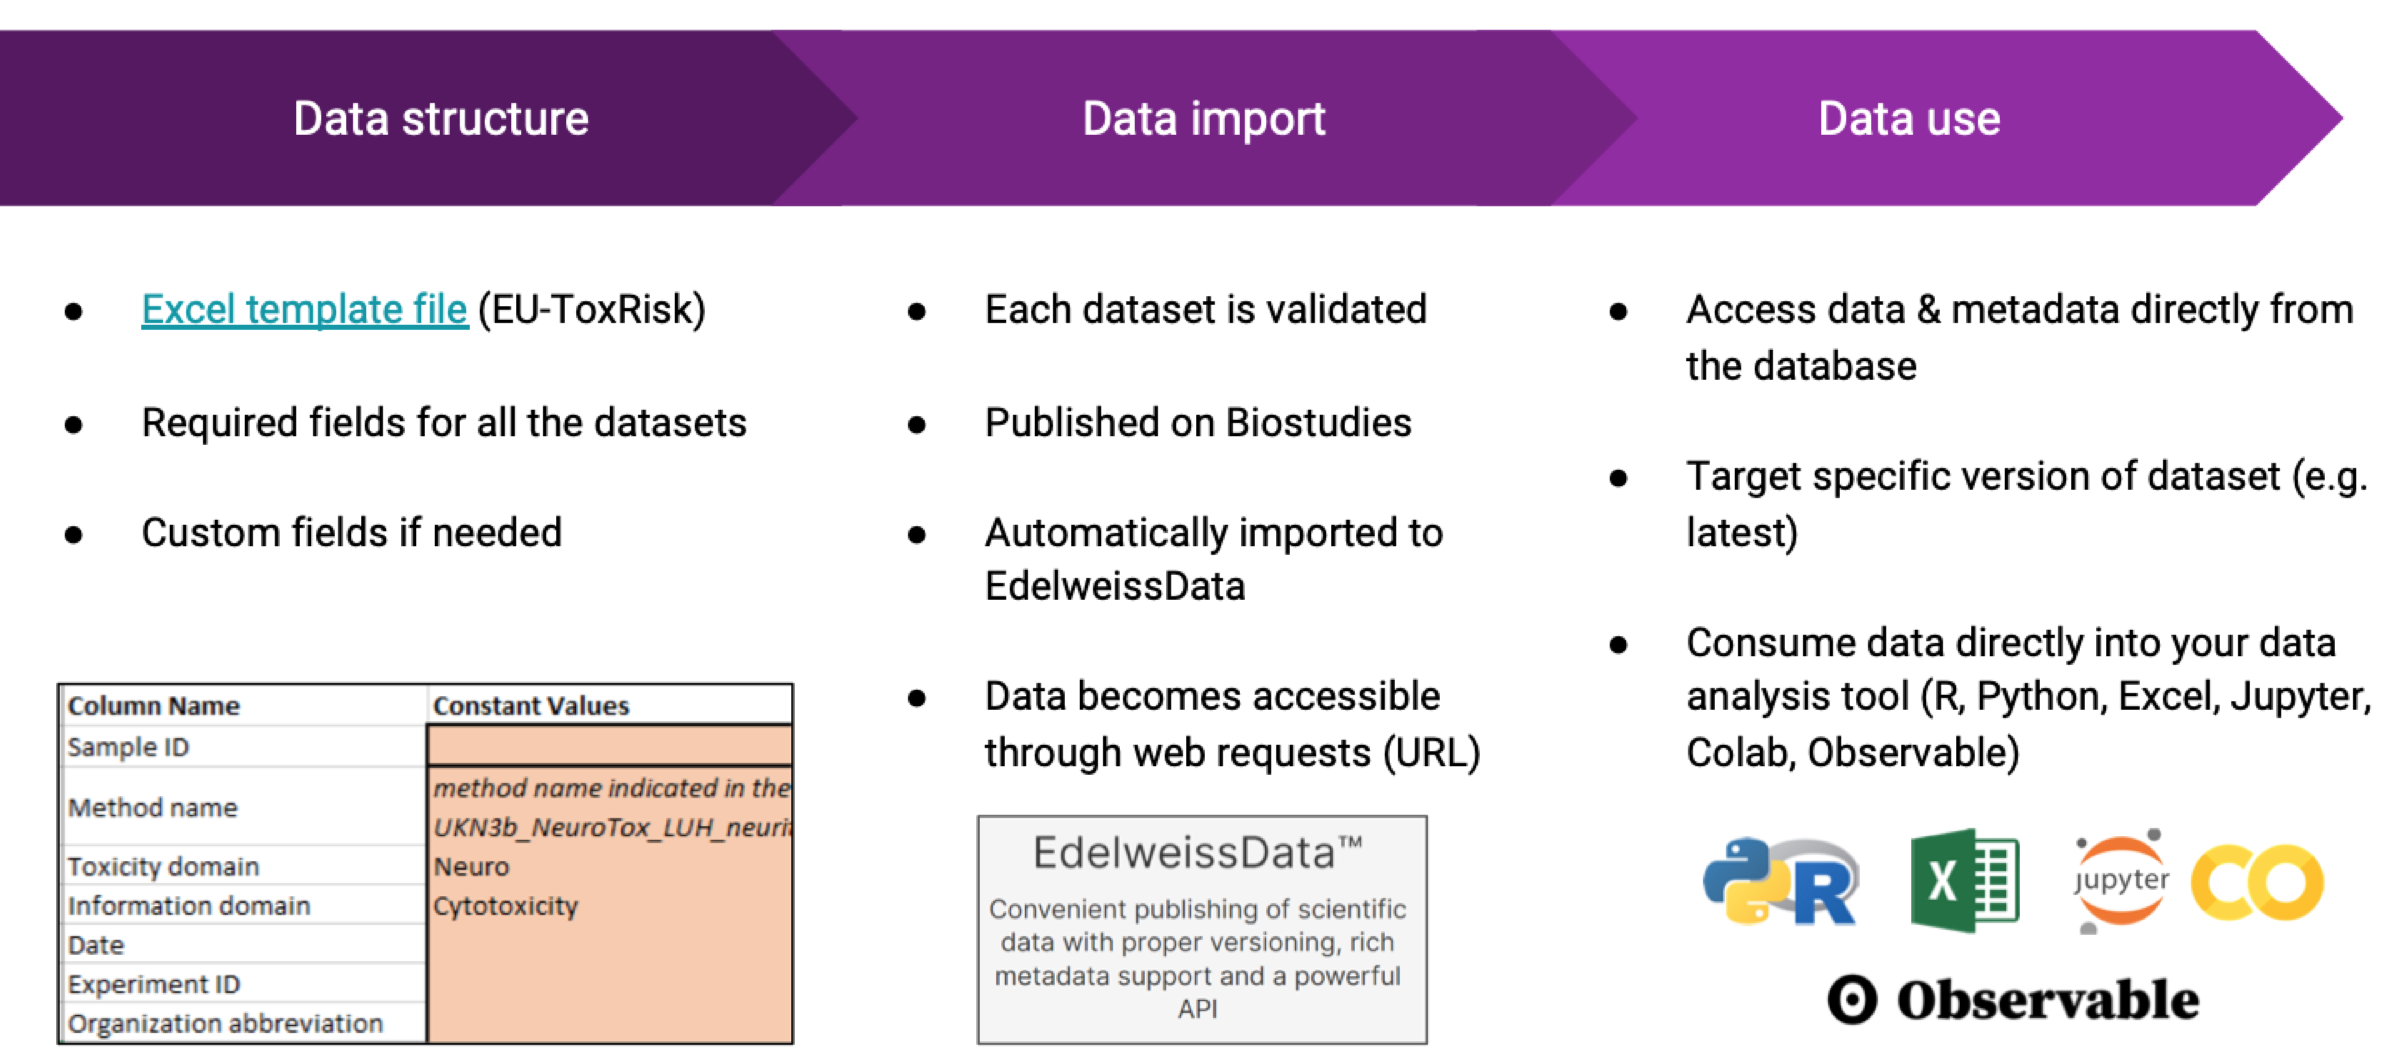
Reliable analysis and consumption of data should be based on a foundation of sound data preparation, well-prepared metadata, data processing protocols, and reliable exposure of data through interfaces to end-user applications for data analysis, risk, and safety assessment. (Overall workflow we have followed on the EU-ToxRisk project on Toxicity Testing and Risk Assessment shown in Figure.)
Video Overview: https://youtu.be/-j78WVkOb80
We provide an example here on Zebrafish DART Assay data from the EU-ToxRisk project that is also the topic of the SaferWorldbyDesign webinar on 1 March. DART (University of Heidelberg) Analysis of Zebrafish DART Assay Data
Another example we have prepared demonstrates how data from in vitro acute toxicity assays on cells from the EC JRC lab can be visualized and analyzed: Cytotoxicity assay (JRC)
Visualization of results from TempOSeq studies
These examples are supported by access to data provided by the EdelweissData service.