PrediSkin Assay
- Ex vivo assay assessing cutaneous cytotoxicity
- Predicts risk of acute skin irritation
- Performed on fresh human skin discs
- Dose-dependent toxicity based on the degree of membranolytic effects
Data management
Motivation
To ensure transparency and reproducibility of data management in a Prediskin assay we employed our EdelweissData solution. Oftentimes today there is raw data produced by instruments that is copy-pasted into an Excel-based template, one file per experiment, where the calculations are done. Such a workflow has two main drawbacks:
- it is difficult to ensure that no mistake was made during copy-pasting of raw data, hence final data quality is questionable. It would be much better if calculations were done directly on the raw data;
- a lot of potential value is lost because each experiment is contained in a separate file and there is no easy way to integrate data from multiple experiments based on for example some characteristics of the experiments (e.g. filtering out all the experiments performed at certain conditions on a certain type of product). This represents a huge obstacle for any kind of data-driven analysis and modelling that could be employed to either gain further insights or improve the existing experiments.
Workflow
To overcome these limitations we integrated EdelweissData with the Prediskin workflow. At a high level the workflow could be summarized as follows:
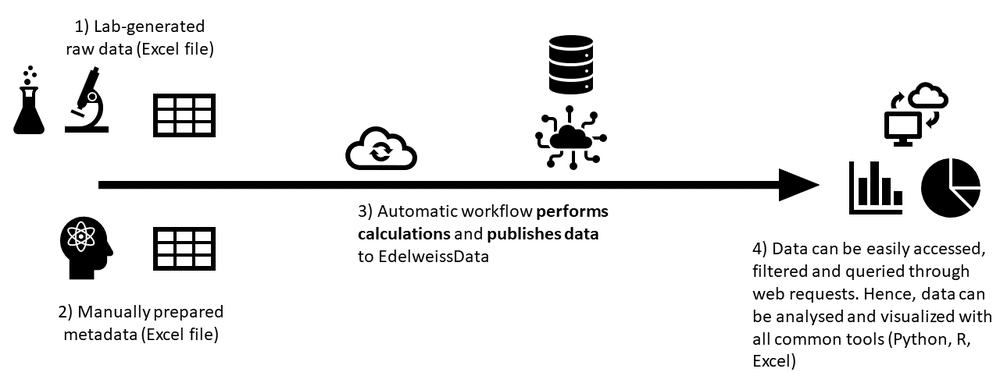
- Instrument produces raw data in Excel format (xlsx file). The file contains readouts of absorbance values per each well on the plate layout. But there is no information on the content of each well.
- User fills in a metadata Excel file that contains all the necessary information about the assay. Among other things the plate layouts are defined herein as well as reference to the machine readouts is provided.
- Automatic workflow takes the two Excel files (readouts and metadata), performs the calculations and publishes the raw data, processed data and summary data to EdelweissData.
- Once the data is published in EdelweissData it becomes easily accessible through web requests. This allows the data to be easily searched, filtered, integrated, analysed and visualized through numerous software applications or notebooks so common in the data science field today (e.g. Python, R, Javascript)
Prediskin workflow
To demonstrate the workflow and supplement the steps above we prepared an example with fake data:
- An example of machine readouts for the Prediskin assay can be found here. The Excel file contains only absorbance values per each well on the plate layout without any information about the well content.
- An example of a metadata file that is manually prepared by the user can be found here.This is a rich multisheet Excel file that contains general information about the experiment, cell line, reagents and standards used as well as well defined plate layouts, samples and blanks.
- For the purpose of demonstration we implemented the automatic workflow in the form of a Colab notebook (Python). By running this notebook the information in Excel files (machine readouts and user-filled metadata) is combined and published as EdelweissData raw dataset.
Once the dataset is published in EdelweissData it becomes easily accessible through web requests. The second part of the workflow (Colab notebook) starts from the published raw dataset, which now contains a complete information of the experiment, performs the calculations and publishes the processed and summary datasets in EdelweissData.
- All datasets published in EdelweissData can be easily filtered, searched, and queried. This allows for example to quickly select a particular experiment(s) based on the sample name (or some other characteristics) as demonstrated in this ObservableHQ notebook.